For the first time since 1974 the UK has a hung parliament, meaning that no party has an overall majority of 326 (or more) seats in the House of Commons. The Conservatives are arguing against electoral reform which includes changes to the first past the post system (they are, however, arguing for reducing the number of seats in the House of Commons).
The reason that the Tories give for liking the first past the post system, where the candidate in each constituency with the most votes is returned by that constituency, is that a hung parliament is less likely. This, they say, results in strong and stable government. Opponents of first past the post argue that the distribution of seats in the House of Commons does not accurately reflect the will of the people, saying that one of the myriad systems of proportional representation would be fairer.
Thanks to The Guardian’s datablog site, all the numbers from yesterday’s polls are available for people to pore over and analyse, and that’s exactly what I’m doing here. This is work in progress at the moment; I’m just seeing what I can find as I sift through. Caveat emptor: I’m assuming The Guardian’s information is correct, needless to say I can’t check it on my own. This is what I’ve come up with so far.
P.S. None of this is in the least bit copyrighted. Pass it off as your own, if you’d like.
Votes per Seat by Political Party
| Party | Votes per seat |
|---|---|
| Conservative | 34,989 |
| Labour | 33,350 |
| Liberal Democrat | 119,788 |
| Democratic Unionist Party | 21,027 |
| Scottish National Party | 81,898 |
| Sinn Fein | 34,388 |
| Plaid Cymru | 55,131 |
| Social Democratic & Labour Party | 36,990 |
| Green | 285,616 |
| Alliance Party | 42,762 |
Votes for Political Parties that gained no seats
| Party | Votes |
|---|---|
| UK Independence Party | 917,832 |
| British National Party | 563,743 |
| Ulster Conservatives and Unionists - New Force | 102,361 |
| English Democrats | 64,826 |
| Respect-Unity Coalition | 33,251 |
| Traditional Unionist Voice | 26,300 |
| Christian Party | 18,623 |
| Independent Community and Health Concern | 16,150 |
| Trade Unionist and Socialist Coalition | 12,275 |
| Scottish Socialist Party | 3,157 |
| Total | 1,758,158 |
319,638 people voted for the various independent candidates that ran; Sylvia Hermon was the only one to be elected in North Down, County Down with 21,181 votes.
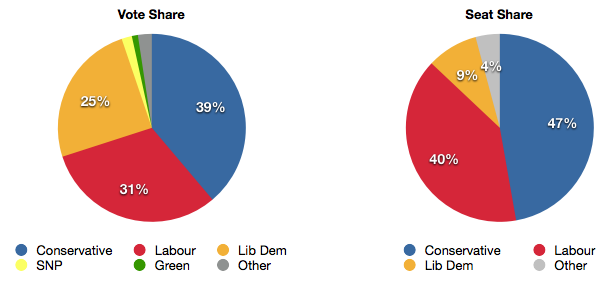
Pie charts of the Vote and Seat shares look like this:
Unused votes
649 constituencies have reported back (the last, Thirsk & Malton, will not go to the polls until May 27th due to the death of the UKIP candidate). A total of 29,650,211 people have voted and 52.84% of them (15,667,992) voted for a losing candidate.
Winning Candidates and their Percentages
The smallest winning percentage of votes was the Lib Dem Simon Wright in Norwich South, who won his seat with just 29.36% of the votes cast. The largest winning percentage was Labour’s Steve Rotheram in Liverpool Walton, with 71.96% of the vote. The mean winning percentage was 47.04%, almost matching the 47.16% who voted for a winning candidate over all constituencies. The graph of winning candidate percentage looks as follows:
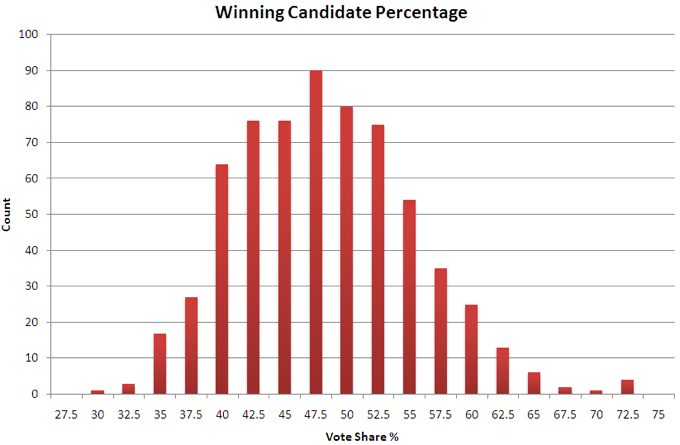
(in each column, the candidates got less than the number at the bottom but more than that of the previous column)
The same data used to create the graph2 shows that in 433 constituencies, 66.72% of all constituencies, more people voted for a losing candidate than for the winner.
Runners-Up and their Percentages
A number of runners-up came very close to winning the seat. The distribution of percentages is as follows (the number of runners-up getting between 40% and 45% of the winner’s votes is a mystery):
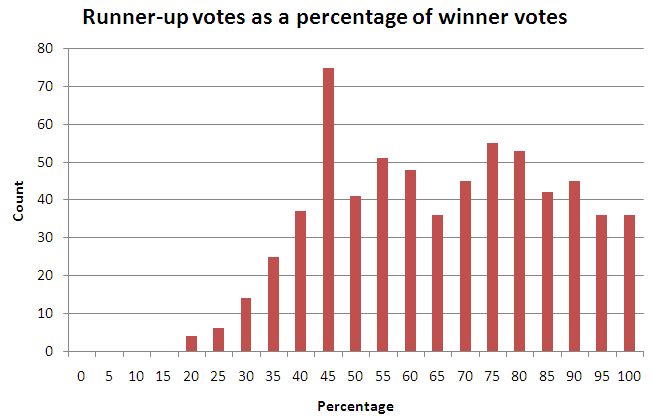
In eleven constituencies the runner-up got 99% or more of the votes of the winner. The top five were:
| Party | Winner Votes | Runner-up Votes |
|---|---|---|
| Fermanagh and South Tyrone | 21,304 | 21,300 |
| Hampstead | 17,332 | 17,290 |
| Warwickshire North | 18,993 | 18,939 |
| Camborne and Redruth | 15,969 | 15,903 |
| Bolton West | 18,327 | 18,235 |
Oxford
Besides a number of wonderful museums, the city of Oxford is blessed with two parliamentary constituencies, Oxford East, and Oxford West and Abingdon. The total of votes for each party over these two constituencies is as follows
| Party | Votes |
|---|---|
| Liberal Democrat | 41,087 |
| Conservative | 33,633 |
| Labour | 27,937 |
| UKIP | 2,720 |
| Green | 2,422 |
| APP | 143 |
| SEP | 116 |
| Parenting | 73 |
From the table we see that the Liberal Democrats enjoyed the votes of nearly 8,000 more people than the second largest party in Oxford, the Conservatives. Unfortunately for the Lib Dems, the votes were divided over the two constituencies in the following way
| Party | Oxford East | Oxford West and Ab. |
|---|---|---|
| Liberal Democrats | 17357 | 23730 |
| Labour | 21938 | 5999 |
| Conservative | 9727 | 23906 |
| Green | 1238 | 1184 |
| UKIP | 1202 | 1518 |
| SEP | 116 | 0 |
| Parenting | 73 | 0 |
| APP | 0 | 143 |
By coming in a strong second place in Oxford East, and being second by fewer than 200 votes in Oxford West, the Liberal Democrats were rewarded with no seat in Oxford. (Thanks to reddit user beccaebdon for pointing this out).
In a similar, though less marked, story to Oxford, the adjacent constituencies of Hexham and Newcastle Upon Tyne North between them saw 27,543 votes for the Lib Dems, ahead of the Conservatives with 26,761 votes and Labour with 26,203. Here, Hexham returned Conservative candidate Guy Opperman whilst Newcastle Upon Tyne North returned Labour candidate Catherine McKinnell.